

- Home » News » Product News

Live machine safety dashboard promises improved uptime

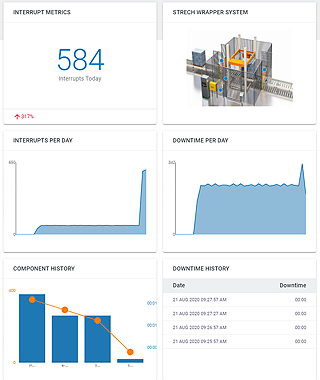
The German-sensor maker Sick has announced a safety monitoring service that generates live visualisations of one or more machines, allowing users to monitor the status of their safety processes in real time. The Safety Machine Analytics software can help to investigate the causes of stoppages and eliminate them, as well as providing longer-term analyses to help improve maintenance and productivity.
The software collects data from safety sensors and actuators connected to a Sick Flexi Soft safety controller and routed via a dedicated gateway to a Web-enabled device such as an industrial PC, tablet, smartphone or laptop. It displays any interruptions in real time, as well as generating graphical representations of system trends, helping to improve OEE (overall equipment effectiveness).
“The benefits of extracting data from sensors at the heart of machines have become well accepted as part of Industry 4.0 condition monitoring, however, for some users, connecting to safety systems may still feel daunting,” explains Dr Martin Kidman, Sick UK’s machinery safety product manager. “Sick Safety Machine Analytics is a simple and secure way of taking a virtual tour around the safety systems on your machines to look for any weak spots.
“You can drill down and identify any interrupts, so they can be quickly rectified,” he adds. “Once connected to a machine, this system offers a low-investment opportunity to identify where gains can be made in productivity by increasing machine uptime.”
Users can upload images of their machines and overlay safety sensors onto the images, allowing easy navigation of real-time data. With access rights set by the administrator, the system then provides instant feedback, as well as longer-term historical analyses for maintenance and production management.
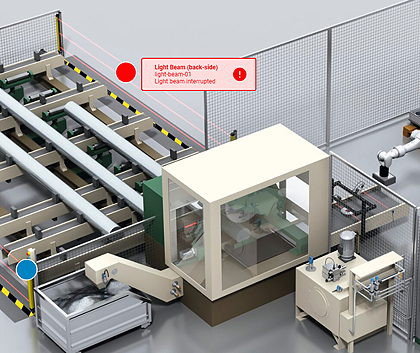
Using the collected data, users can track system history using their own KPIs (key performance indicators) – for example, comparing a daily analysis of downtime with longer-term patterns to get a better understanding of system performance. Data can also be investigated for individual components – for example, monitoring safety proximity sensors to see how often a door is opened or closed.
Information from the Flexi Soft controller is sent to the software via a standard Ethernet connection. All safety events are stored in an event log, enabling detailed analyses and helping to identify system improvements.
Sick: Twitter LinkedIn Facebook